LGMD 2D: α-Sarcoglycan deficiency
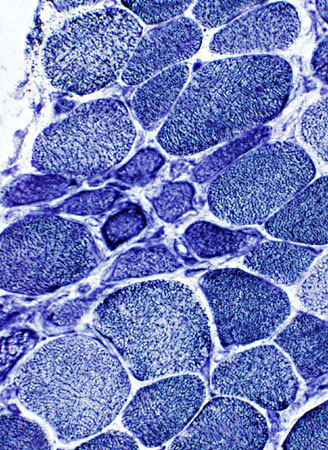
Muscle: General features
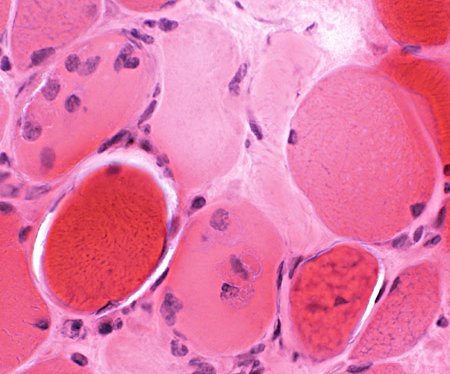
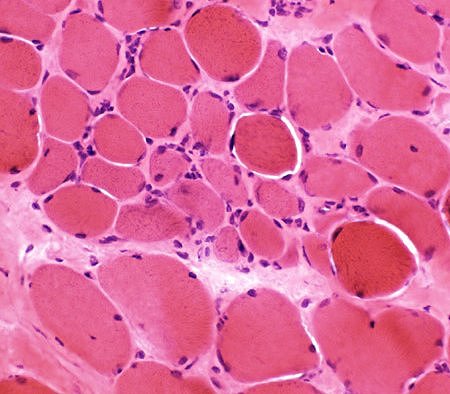 H&E stain Muscle fibers: Features Varied sizes Hypercontraction Myopathic groups: Clusters of smaller muscle fibers Endomysial connective tissue: Increased between muscle fibers |
Muscle Fiber Degeneration: Grouped Pathology
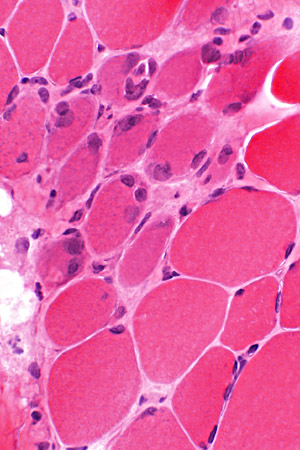
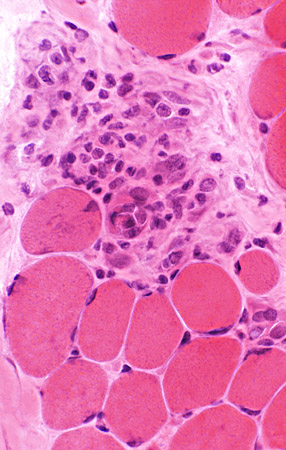 H&E stain Group of degenerated muscle fibers
|
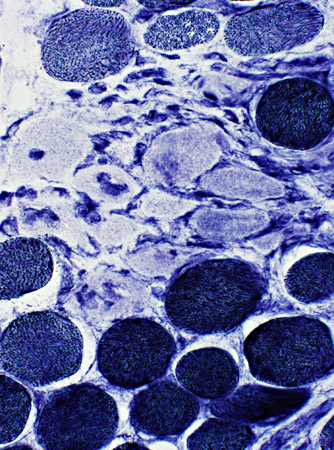 NADH stain Degenerating muscle fibers: Reduced NADH stain
|
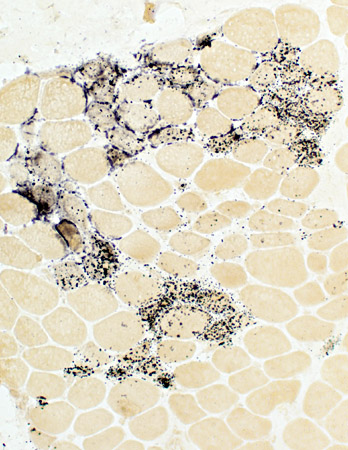
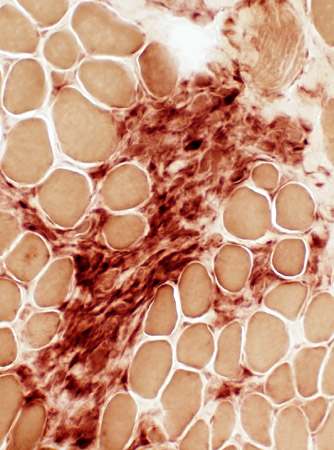 Acid phosphatase stain Acid phosphatase-stained cells
in region of degenerated muscle fibers |
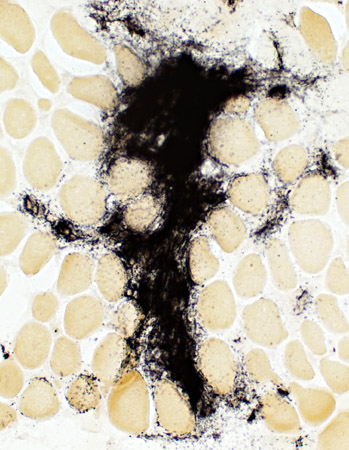 Alkaline phosphatase stain Alkaline phosphatase staining
in region of degenerated muscle fibers |
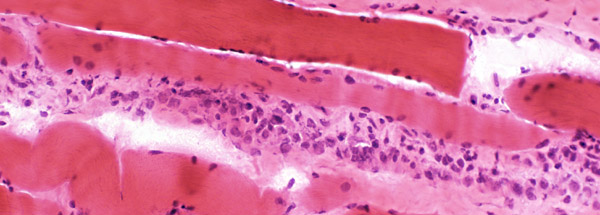 H & E stain Necrotic muscle fiber replaced by cells: Longitudinal view
|
 H&E stain Necrotic & Regenerating (Immature) muscle fibers
|
Muscle Fiber Regeneration
 H&E stain Group of regenerated muscle fibers
|
 NADH stain Small regenerated muscle fibers: Dark on NADH stain
|
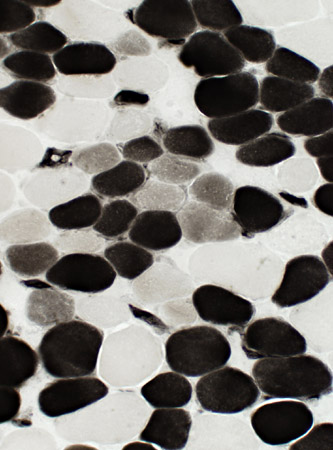 ATPase stain, pH 4.3 Immature muscle fibers: Intermediate staining
|
 Alkaline phosphatase stain Immature muscle fibers: Alkaline phosphatase
|
LGMD 2D: Dystrophy-related protein staining
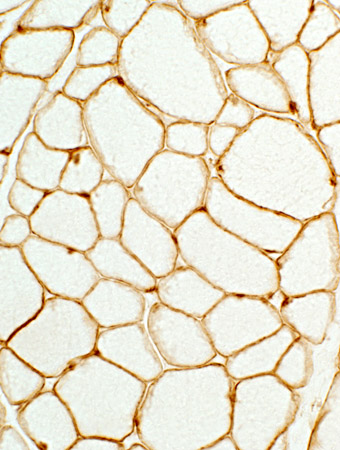
α-Sarcoglycan
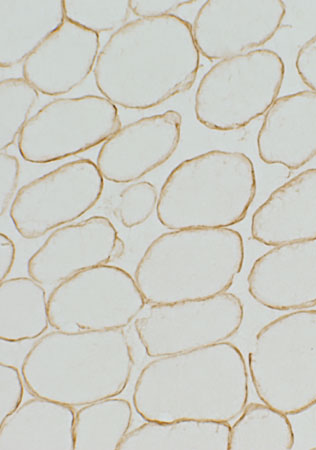
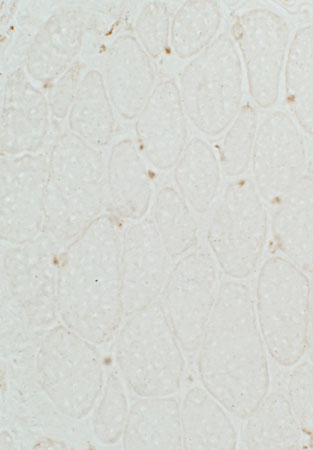 α-Sarcoglycan LGMD 2D: Markedly reduced
|
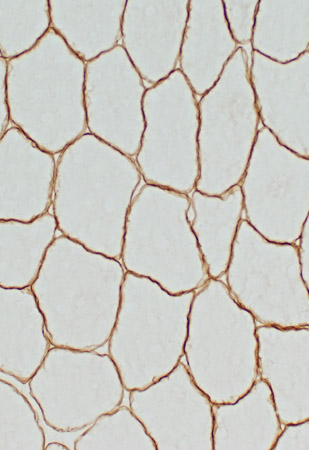
 α-Sarcoglycan Normal levels: Present around rim of muscle fibers
|
Dystrophin
 Dystrophin LGMD 2D: Mildly reduced
|
 Dystrophin Normal: Present around rim of muscle fibers
|
Return to Neuromuscular Home Page
Return to LGMD 2D
7/28/2023